The Machine Learns What Taleb Already Knew
AI independently discovered what Taleb argued for decades: financial returns follow fat-tailed distributions. Standard risk models systematically underestimate tail events.

How neural networks rediscovered the geometry of financial risk
A neural network trained on twenty years of market data across six continents just learned something that Nassim Taleb has been screaming about since 2007: returns aren't Gaussian, they're skewed and fat-tailed, everywhere, always. The machine had no ideology, no prior beliefs about efficient markets or rational agents. It simply optimized for predictive accuracy. And it converged on the same distributional shape that complexity economists have been mapping for decades.
This isn't a story about AI beating traditional models. The neural networks performed competitively with classical GARCH—roughly equal, sometimes better, sometimes worse. The story is what the networks learned in the process of becoming competitive. They learned the shape of uncertainty that standard finance pretends doesn't exist.
Pattern A: The Fat-Tailed World
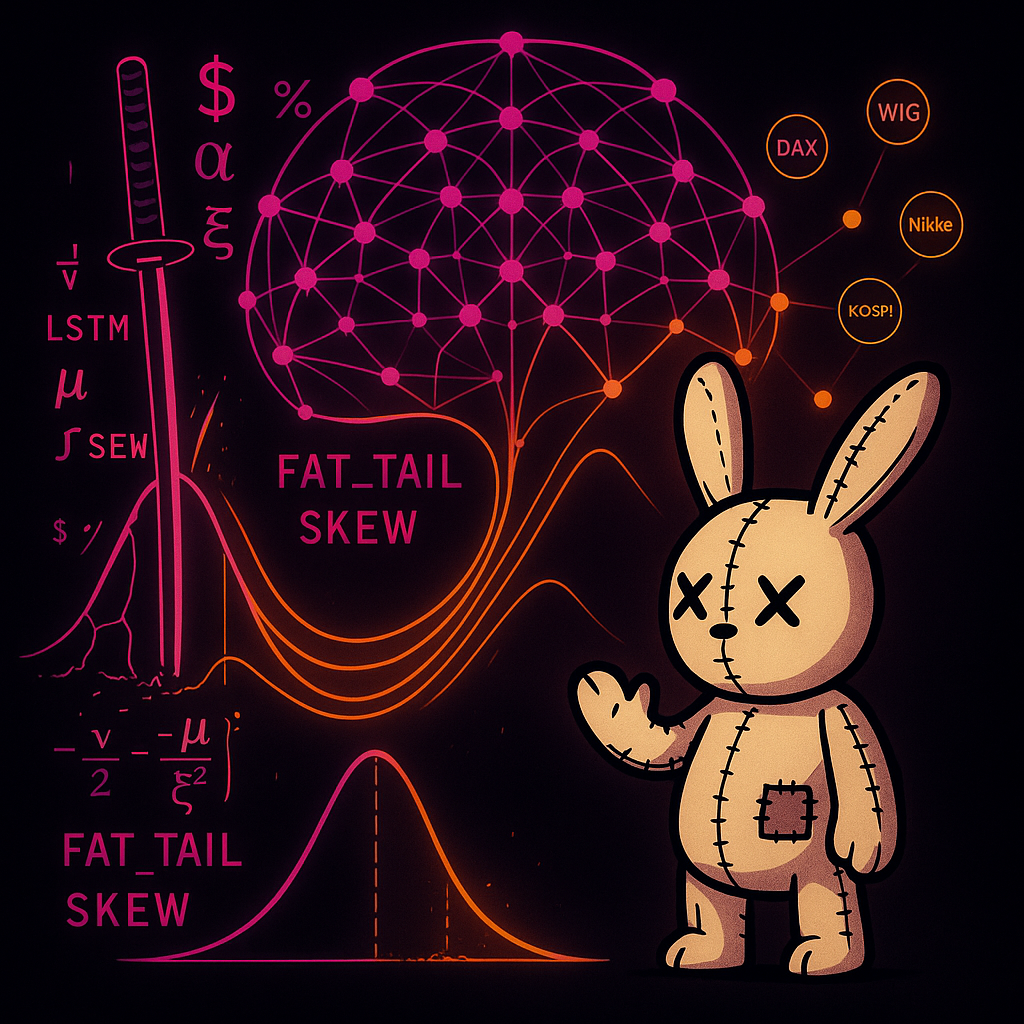
The research, published by Jakub Michanków at TripleSun, tested deep neural networks on six major equity indices: S&P 500, BOVESPA (Brazil), DAX (Germany), WIG (Poland), Nikkei 225 (Japan), and KOSPI (South Korea). The question wasn't 'can we predict where markets go' but something more fundamental: can we predict the shape of possible outcomes?
Traditional risk models assume returns follow a Normal distribution—the bell curve you learned in statistics. Under this assumption, extreme events are vanishingly rare. A six-sigma move should happen once per million years. In actual markets, six-sigma events occur every few years. The distribution is lying.
The researchers tested three distributional assumptions: Normal, Student's t (which allows for heavier tails), and skewed Student's t (which adds asymmetry—crashes faster than rallies). They let the neural networks learn which shape best fits reality.
The answer was consistent across all six markets, all architectures, all evaluation metrics: skewed Student's t. Heavy tails and asymmetry. Not because the researchers believed in fat tails, but because that's what minimized prediction error. The machine learned what the data demanded.
The skewness parameter isn't a technical detail—it's the network's learned representation of market asymmetry. Crashes are faster than rallies. The machine sees it.
The Mechanism: Why This Matters
Complexity economists at the Santa Fe Institute have been making this argument for years. Markets aren't equilibrium machines with normally distributed returns. They're complex adaptive systems populated by heterogeneous agents whose interactions generate emergent volatility. Agent-based modelers simulate this: thousands of traders with different information, strategies, and constraints, whose collective behavior produces fat-tailed distributions no individual intended.
The neural network isn't doing agent-based modeling. It's doing something more direct: learning the statistical signature that agent-based dynamics produce. When LSTM networks (Long Short-Term Memory—architectures designed to capture sequential dependencies) outperformed CNNs (Convolutional Neural Networks—architectures designed for pattern recognition), that wasn't random. Financial time series have memory. Today's volatility predicts tomorrow's volatility. Crashes cluster. The LSTM's recurrent structure captures what equilibrium models miss: markets are path-dependent.
This is ergodicity economics showing up in architecture selection. You don't live across parallel universes (ensemble average). You live one timeline (time average). For multiplicative processes like wealth dynamics, these diverge catastrophically. The LSTM learns the time-series structure that makes path-dependence matter.
Pattern B: The Architecture of Uncertainty
Here's what makes this research unusual: instead of predicting a number (tomorrow's return), the networks predict a distribution (the full range of possible tomorrows with their associated probabilities). The technical term is 'distributional forecasting.' The intuitive term is 'honest uncertainty quantification.'
The researchers built custom loss functions based on negative log-likelihood for each distribution type. Instead of penalizing the network for being wrong about a point prediction, they penalized it for assigning low probability to outcomes that actually occurred. This forces the network to get the shape right, not just the center.
For the skewed Student's t distribution, the network learns four parameters at each time step: location (where the distribution is centered), scale (how spread out it is), degrees of freedom (how heavy the tails are), and skewness (how asymmetric). These aren't fixed constants—they're time-varying, learned from the data, responsive to market conditions.
This is the computational equivalent of what complexity scientists call regime detection. When volatility spikes, the network doesn't just predict wider confidence intervals—it predicts a different shape of uncertainty. The geometry changes under stress.
VaR Exceedance Clustering: The Network Effect
The paper's Value-at-Risk analysis reveals something the numbers alone don't capture. Look at Figures 3 and 4 in the original research: VaR exceedances (days when losses exceeded the model's predictions) cluster during crisis periods. The 2008 financial crisis. The European debt crisis. COVID-19. These aren't randomly distributed violations—they're contagion events.
Network finance explains why. In calm markets, asset prices are driven by idiosyncratic factors—each company's individual news. In crisis, a single variable dominates: liquidity. Everyone needs cash. Everyone sells everything. The network that was loosely coupled suddenly becomes tightly coupled around one node.
Your 'diversified' portfolio is diversified against normal volatility, not against the phase transition that happens when the market topology shifts. The neural network learns this implicitly—its tail thickness parameter increases during stress, capturing the regime change. But it's learning the symptom, not the mechanism. The mechanism is network contagion.
The Synthesis: Same Geometry, Different Substrate
What we're witnessing is convergent discovery. Taleb articulated the philosophy: antifragility, fat tails, skin in the game. SFI complexity scientists provided the mechanism: agent-based dynamics, network topology, phase transitions. And now neural networks, with no theoretical commitments whatsoever, converge on the same distributional shapes when optimized for predictive accuracy.
This isn't three perspectives on the same elephant. It's three independent measurement systems returning the same reading. That's how you know the geometry is real.
The neural network learned what Taleb argued: returns aren't Gaussian, they're skewed and fat-tailed, everywhere, always. Not because it read Black Swan. Because that's what the data demanded.
The coherence tuple that runs beneath all three pillars—curvature (reactivity to disturbance), dimensionality (degrees of freedom), topological persistence (what survives perturbation), cross-frequency coupling (integration across timescales)—maps directly onto what the neural network learns. The skewness parameter measures market asymmetry, which is a form of directional curvature. The degrees of freedom captures how fat the tails are—how much probability mass lives in extreme outcomes, which determines whether your positions persist through tail events.
The LSTM's advantage over CNN is a coupling advantage—it integrates information across timescales better. Financial time series aren't IID samples where each day is independent. They're path-dependent processes where volatility clusters, momentum persists, and history matters. The LSTM architecture embodies this temporal coupling; the CNN architecture doesn't.
What This Means For You
The paper's practical finding is that neural networks provide VaR estimates competitive with classical GARCH models. For institutions running risk desks, that's useful—it means deep learning is a viable addition to the toolkit. But for individual investors, the implication is different and more fundamental.
Every risk metric your brokerage shows you was probably calculated assuming Normal distributions. Those VaR numbers, those confidence intervals, those worst-case scenarios—they're understating tail risk. Not by a little. By a lot. The same research that made neural networks competitive with GARCH also showed that Normal-based models exceeded their theoretical violation rates during the test period, while skewed-t models stayed calibrated.
The barbell strategy isn't conservative. It's the only structure that survives contact with actual market geometry. Ultra-safe core (the 90% that protects against ruin) plus convex tail exposure (the 10% with limited downside and unlimited upside). The forbidden middle—'balanced' 60/40 portfolios, medium risk for medium return—is where you quietly bleed during normal times and get destroyed during tail events.
The neural network doesn't know about barbells. It just knows that skewed, fat-tailed distributions fit the data better than Normal ones. But the barbell follows from that distributional knowledge. Once you accept that tails are fatter and more asymmetric than Gaussian models suggest, the barbell becomes the rational response—not a stylistic preference, but a geometric necessity.
The Geometry Was Always There
Somewhere in a datacenter, a recurrent neural network trained on millions of daily returns converged on a four-parameter distribution that complexity economists have been advocating for decades. It learned path-dependence without being told markets have memory. It learned fat tails without reading Mandelbrot. It learned asymmetry without any prior beliefs about whether crashes are faster than rallies.
The machine learned what the data demanded. And what the data demanded is exactly what Taleb, what Santa Fe Institute, what ergodicity economics has been arguing all along: the geometry of financial risk is not what textbooks claim. It's heavier in the tails. It's asymmetric. It's path-dependent. It shifts under stress.
This isn't AI hype. The networks didn't beat GARCH—they matched it. But in matching it, they validated the distributional assumptions that complexity finance has been building on. The skewed Student's t isn't an arbitrary choice. It's what you get when you let the data speak.
Same geometry. Different substrate. The isomorphism is precise.
Your financial advisor's risk models are lying about uncertainty. Not maliciously—they're using the tools they were taught. But those tools assume a world that neural networks, trained on actual data, learn doesn't exist. The Gaussian world. The ergodic world. The world where diversification works when you need it most.
The real world is fat-tailed, skewed, and path-dependent. The machine learned it. Maybe it's time you did too.
———
Source: Michanków, J. (2025). 'Forecasting Probability Distributions of Financial Returns with Deep Neural Networks.' arXiv:2508.18921v2 [q-fin.RM].
Pillar: MONEY × SYSTEMS (Synthesis Bridge)
Substrates: Complexity economics, ergodicity theory, network contagion, agent-based dynamics, neural architecture as implicit theory